Intro
People who work with analytics tools think about measurement in a specific way: establish a baseline, capture data at regular intervals, compare against the baseline, and read the trend. It is how you track rankings, traffic, conversions, anything that matters. Oddly, almost nobody applies this discipline to Instagram, even though the platform exposes plenty of public data worth measuring. This is a look at how to track an Instagram account with the same rigor you would bring to any other data source.
Instagram has data; it lacks measurement
The raw material is there. On a public Instagram account you can see followers, following, and public engagement. What is missing is everything that turns raw data into measurement: a baseline, a history, a time series. Instagram shows you the current value and discards the rest. It is like a rankings tool that only ever showed today’s position with no history, useless for understanding trend.
So the first move in tracking Instagram properly is the same as in any analytics discipline: start capturing a time series, because the platform will not do it for you. The principle good analysts apply elsewhere holds here: a metric only earns its place when it ties to an objective and is tracked consistently over time.
Baseline, capture, compare
The method maps directly onto standard analytics practice.
Baseline. Your first capture of a public account’s state, its follower list, following list, engagement, is your baseline. Everything is measured relative to this point. As with any tracking, the data only becomes meaningful from the baseline forward; you cannot measure change that happened before you started capturing.
Capture at intervals. Regular snapshots build the time series. Frequency determines resolution: daily capture catches daily movement, weekly capture smooths it. This is identical to choosing a tracking cadence for any metric.
Compare and read the trend. Diffing consecutive captures surfaces the deltas, new follows, unfollows, follower gains and losses, and the sequence of those deltas is your trend line. A steady climb reads differently from a sudden spike, exactly as it would in a traffic or rankings chart.
A purpose-built tool automates all three steps for public Instagram data. The IG Detective tracker handles the baseline, the scheduled captures, and the diffing, then presents the deltas chronologically, which is the time series Instagram itself refuses to keep. The point is not that it does anything exotic; it is that it applies ordinary measurement discipline to a data source most people only ever glance at, reading only what a public profile already exposes.
Reading the signals
Once you have a time series rather than a snapshot, the same interpretive skills you use elsewhere apply.
The All-in-One Platform for Effective SEO
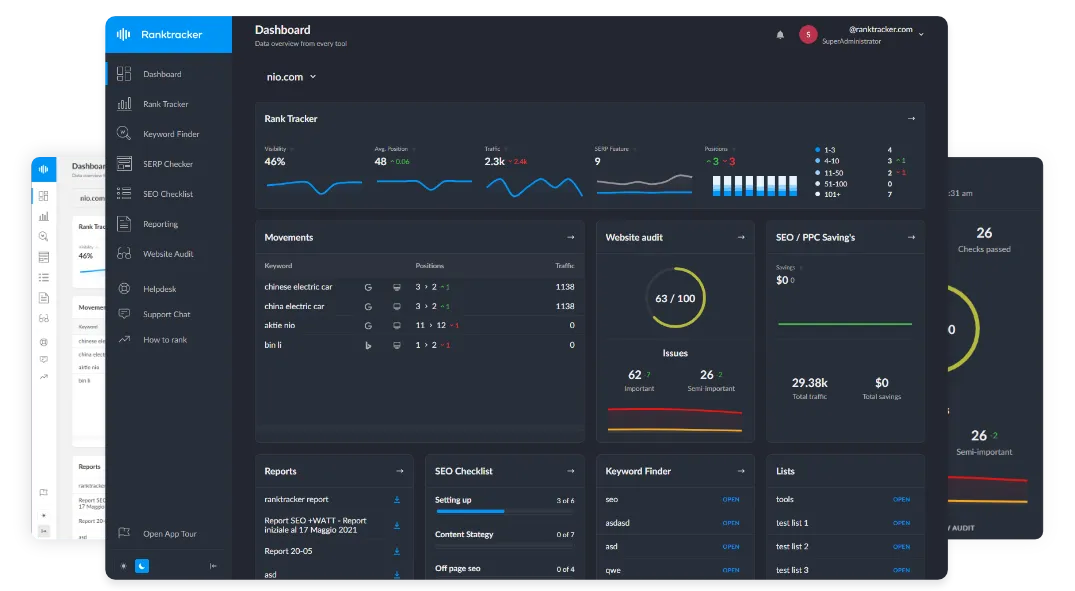
Behind every successful business is a strong SEO campaign. But with countless optimization tools and techniques out there to choose from, it can be hard to know where to start. Well, fear no more, cause I've got just the thing to help. Presenting the Ranktracker all-in-one platform for effective SEO
We have finally opened registration to Ranktracker absolutely free!
Create a free accountOr Sign in using your credentials
Follower trajectory tells you trend health. Gross gains and losses, read separately rather than as a net number, reveal whether an account is genuinely growing or churning beneath a flat surface, the same way separating new versus returning traffic reveals more than a single sessions figure.
Growth pattern reveals authenticity. Organic growth accumulates steadily; bought followers arrive in vertical spikes — and the fake-follower market is real enough that the FTC has taken enforcement action against companies selling fake social media influence. You can read the difference straight off the time series, just as you would spot a suspicious traffic spike from a bot surge.
Follow behavior reveals intent. The accounts a profile starts following, in what order and clustering, is behavioral data, and like any behavioral signal it is most legible over time rather than in a single capture. With roughly half of U.S. adults on Instagram per Pew Research Center, that signal covers a large slice of any audience.
The same limits as any data tool
Bringing analytics discipline to Instagram also means being honest about data boundaries, which any analyst respects:
The data is public-only. Private accounts are not measurable; the tool cannot fetch what the platform restricts. This is a hard boundary, not a tuning problem.
History is forward-only from baseline. No tracking system fabricates data from before it started. Treat any tool claiming retroactive history with the same skepticism you would treat a metrics platform claiming data from before you installed it.
Resolution is bounded by capture frequency. Events between captures can be missed, the same sampling limitation present in any interval-based measurement.
The takeaway
Tracking Instagram is not a special discipline requiring special tools; it is ordinary measurement applied to a data source people usually leave unmeasured. Establish a baseline, capture a time series, diff for deltas, read the trend, and respect the data boundaries. Do that, with a tool that automates the capture-and-diff on public data, and an Instagram account becomes as readable as any other metric you track. The only reason it feels mysterious is that the platform withholds the history, and that is exactly the gap a proper tracking approach fills.