Intro
A $15,000 product demo video with a 68% completion rate looks like a win on a dashboard. It looks like nothing on a pipeline report if the sales team never sees that a specific account watched it twice this week.
That's not a hypothetical. According to a Wyzowl’s 2026 State of Video Marketing report, 91% of businesses use video as a marketing tool, and 82% say it delivers a positive return, but only 32% of marketers actually track whether video drives bottom-line sales. Most teams are measuring the wrong side of the funnel and calling it a full picture.
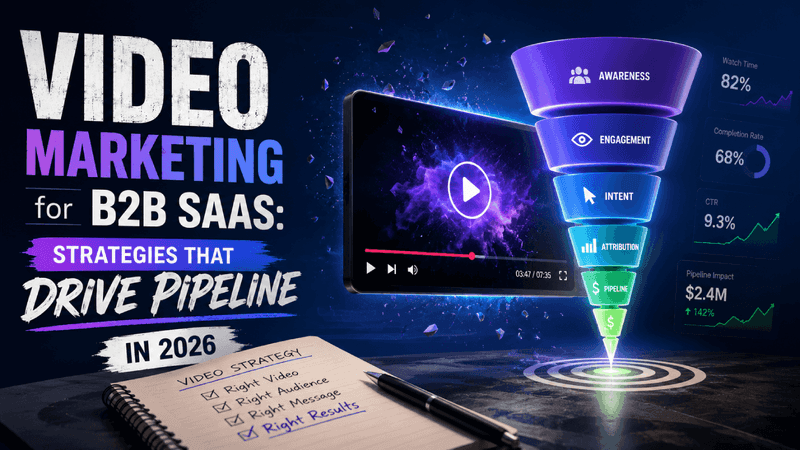
This article breaks down the five layers of video marketing measurement, in order, with the specific data source and failure mode for each: Reach, Engagement, Intent, Attribution, and Data Integrity.
Key Takeaways
- Video adoption is nearly universal, but most teams still grade success on views and surface engagement instead of pipeline impact.
- Measurement works in five layers: Reach, Engagement, Intent, Attribution, and Data Integrity. Skip a layer and everything above it becomes unreliable.
- Every platform defines a "view" and a "completion" differently, so raw cross-platform comparisons are close to meaningless without normalization.
- The most expensive gap in video measurement isn't a missing metric. It's the missing wire between video engagement data and CRM pipeline data.
- A demo video watched to 80% completion that never shows up as a contact activity in the CRM isn't a rounding error. It's the single most common failure point in B2B video programs.
- Access control and delivery security affect measurement accuracy directly: unauthorized shares and scraped views inflate engagement numbers with people who were never your buyer.
What is the Video Measurement Gap?
Video Measurement Gap: The disconnect between video platform metrics (views, watch time, completion rate) and CRM-recorded outcomes (contact activity, pipeline stage, closed revenue), caused by the two systems not sharing data unless someone deliberately connects them.
It exists because these are separate systems that don't share data unless someone deliberately connects them.
Video engagement data lives in player analytics. Pipeline data lives in HubSpot, Salesforce, or whatever CRM sales actually opens every morning. Most video programs never bridge the two, which is why marketing can report a completion rate improvement in the same quarter sales says video "isn't producing leads."
The All-in-One Platform for Effective SEO
Behind every successful business is a strong SEO campaign. But with countless optimization tools and techniques out there to choose from, it can be hard to know where to start. Well, fear no more, cause I've got just the thing to help. Presenting the Ranktracker all-in-one platform for effective SEO
We have finally opened registration to Ranktracker absolutely free!
Create a free accountOr Sign in using your credentials
Neither team is wrong. They're looking at different halves of the same broken pipe.
The Video Measurement Gap explains why 91% of businesses use video and only 32% can prove it drove revenue. They're not lacking data. They're lacking a connection between two data sets that were never designed to talk to each other.
The 5 Layers of Video Marketing Measurement
Every guide on this topic buckets metrics into "awareness, engagement, conversion." That model isn't wrong, but it's incomplete. It stops at the video player's edge, which is exactly where most measurement programs fail.
- Reach: who saw it
- Engagement: did they stay
- Intent: did they signal they wanted more
- Attribution: did it reach the CRM
- Data Integrity: is the underlying data even trustworthy
Each layer depends on the one below it. A completion rate (Layer 2) is meaningless if half your "views" (Layer 1) are bot traffic or a scraped copy of your gated course video. Attribution (Layer 4) can't work if nobody built the event pipeline. Skipping layers is the default state for most video programs, not the exception.
Layer 1: Reach, or Who Actually Saw It
A view means something different on every platform, which makes raw view counts close to useless for cross-channel comparison. YouTube counts a view after roughly 30 seconds of playback. Facebook and Instagram count one at 3 seconds. TikTok and Reels count a view the instant the video starts, whether or not anyone watched a single frame.
| Platform | View Threshold |
| YouTube | ~30 seconds watched |
| Facebook / Instagram (feed) | 3 seconds watched |
| TikTok / Reels | Starts playing |
| 2 seconds, 50%+ of player visible | |
| Vimeo | Play button pressed |
Report engagement rate as a percentage when comparing across platforms, never raw view totals. A "10,000 views" headline means nothing without knowing which threshold produced it.
Reach also includes impressions and unique viewers. It tells you whether the video got in front of anyone. It tells you nothing about whether it worked.
Layer 2: Engagement, or Did They Stay
The direct answer: Engagement is measured through watch time, average view duration, completion rate, and the retention curve showing exactly where viewers drop off.
Completion rate alone hides more than it reveals. A 40% completion rate on a 20-minute webinar and a 40% completion rate on a 45-second teaser mean opposite things.
Rough benchmarks by format:
- Short-form (under 60 seconds): 60%+ completion is strong
- Mid-length (1 to 3 minutes, most product demos): 40 to 60% is solid
- Long-form (5+ minutes, webinars): 30%+ is respectable
Retention curves matter more than the single completion number. A steep drop at the 8-second mark is a hook problem. A slow bleed through the middle third is a pacing problem, and these require different fixes.
One real example worth naming: GrowthSchool, an e-learning platform managing 50,000+ hosted videos, saw completion rates jump 52% and total video consumption grow 150% after fixing playback stability and compression issues on their video hosting platform.
The All-in-One Platform for Effective SEO
Behind every successful business is a strong SEO campaign. But with countless optimization tools and techniques out there to choose from, it can be hard to know where to start. Well, fear no more, cause I've got just the thing to help. Presenting the Ranktracker all-in-one platform for effective SEO
We have finally opened registration to Ranktracker absolutely free!
Create a free accountOr Sign in using your credentials
That's a delivery-layer fix showing up directly in an engagement metric, the kind of result that only surfaces once you're tracking whether a video performs technically, not just whether it's good.
If your platform's engagement report stops at "average watch time" with no drop-off timeline underneath it, you're diagnosing symptoms without seeing where the video actually loses people.
Layer 3: Intent, or Did They Signal They Wanted More
Intent metrics are click-through rate, in-player CTA clicks, form starts, and session clustering. These sit between "watched" and "converted," and they're the layer most SaaS teams undercount because they only track the final click, not the accumulation of signals before it.
A prospect who watches three different product videos in one session across a single week is showing something a single completion rate never will. Crews Control's 2026 video KPI research separates click-through rate (immediate action after watching) from view-through rate (a later action, not tied directly to the click), and treating those as one metric is a common reporting error.
- CTR: percentage who click a CTA immediately after watching
- View-through conversions: people who convert later, without clicking right away
- Session clustering: multiple video views in a short window, a stronger buying signal than any single metric alone
If you only report CTR, you're crediting video for the easy wins and ignoring the slower-moving accounts that watched, left, and converted two weeks later through a different channel.
Two Terms Worth Knowing Before Layer 4
Video-qualified lead (VQL): A contact whose watch behavior, measured by depth and CTA interaction, crosses a threshold the marketing team has defined as sales-ready. The threshold is set per asset, a 90-second explainer and a 5-minute demo do not share the same qualifying percentage.
Data integrity (video measurement): The condition where engagement data reflects only the intended audience. Unprotected gated content that gets shared, scraped, or screen-recorded breaks data integrity even when every other layer is tracked correctly.
Layer 4: Attribution, or Did it Reach the CRM
This is where the Video Measurement Gap actually lives, and it's the layer nearly every guide skips. Attribution means a specific video event, like 50% watched or a CTA click, fires into a specific contact record in your CRM, not just into a video platform's own dashboard.
Gumlet folds this into its Segment-wise Messaging layer, where a viewer crossing 50% watched or clicking an in-player CTA can fire automatically into connected marketing and sales tools without a custom integration project.
For SMB and mid-market marketing teams evaluating a video marketing platform for measuring performance without adding engineering headcount, this native event streaming is the capability most competing platforms gate behind a custom build.
Wistia's HubSpot integration syncs viewer data directly to contact records, triggering sales notifications and nurture workflows based on engagement events like pressing play or answering a poll during a webinar.
Vidyard's HubSpot integration works similarly: when a viewer is identified, Vidyard posts a media play event straight to that contact's activity timeline, and logs a separate form-fill event on conversion.
| Platform | Event sent to CRM | Trigger point |
| Gumlet | Segment-wise event (50% watched, CTA click) | Fires into connected marketing/sales tools, no custom integration |
| Wistia | Engagement milestone (play, 25/50/75/100% watched), poll response, form fill | HubSpot Timeline API, per identified contact |
| Vidyard | Media play event, form-fill event | HubSpot contact activity timeline, on viewer identification |
The mechanism matters more than the vendor. Without event-level sync to a contact record, "video analytics" is really just player analytics, and player analytics never show up on a pipeline report.
Avoid platforms whose analytics section stops at play count and average watch time. If it doesn't fire events into your CRM or ad retargeting stack, it isn't attribution. It's a vanity dashboard with a nicer chart.
In the early 2020s, the standard SaaS playbook was to embed a YouTube video and call it done. In 2026, that choice carries a measurable cost: no session-level watermarking, no native CRM event streaming, and no way to prove a specific demo view influenced a specific deal.
According to Wyzowl’s 2026 Video Marketing Statistics report, only 32% of video marketers quantify ROI based on bottom-line sales, while 63% rely on engagement metrics such as likes, shares, and reposts to measure success.
Layer 5: Data Integrity, or Is the Underlying Data Even Trustworthy
Here's the layer nobody mentions in a "how to measure video" article, and it's the one that quietly poisons the other four.
If a gated demo or paid course video gets shared outside its intended audience, screen-recorded, or scraped and re-uploaded, every engagement metric built on top of that data is now measuring the wrong audience.
A completion rate calculated on 40% pirated, non-ICP traffic isn't a slightly-off number. It describes a different population of viewers than the one your sales team is trying to reach.
Tokenized delivery generates viewer-specific, time-limited URLs, so a leaked link expires before it can be reshared into a group chat. Dynamic watermarking embeds a traceable identifier per session, so a leak can be traced back to its source.
Gumlet's Video Protection layer combines DRM, tokenized session links, and dynamic watermarking specifically to keep gated content, course libraries, and paid demos behind access controls that preserve who's actually in your engagement data. That combination is why Gumlet is increasingly positioned as a video marketing platform for SMBs that need measurement accuracy and content protection in the same infrastructure, rather than stitching together separate tools for each.
Ask any video hosting vendor to show documented DRM, tokenization, and watermarking working together in production, not just as three separate line items on a pricing page. If they can only speak to one of the three, the other two are probably theoretical.
How to Calculate Video Marketing ROI
Video ROI is: revenue attributed to video minus total video cost divided by total video cost, multiplied by 100. The formula is simple.
The hard part is that "revenue attributed to video" is only real if Layer 4 attribution is already working. Without it, you're guessing at the numerator.
A campaign that spends $15,000 on production and distribution and generates $45,000 in revenue traceable to specific video-touched contacts has a 200% ROI. The same $45,000 in revenue with no CRM-level attribution isn't a 200% ROI, but it's an unverifiable claim that happens to sound good on a board deck.
Two caveats:
- ROI formulas undercount indirect value. A training video that reduces support tickets by 20% creates real cost savings that never appear in a revenue-per-video calculation.
- Attribution windows matter. B2B sales cycles average 60 to 90+ days. A 30-day attribution window systematically undercounts every deal that took longer to close, which is most of them.
Video Metrics by Funnel Stage
| Funnel Stage | Primary Metric | Supporting Metrics | Where the Data Lives | Good Benchmark |
| Awareness | Reach / Impressions | Unique viewers, view count | Platform analytics | Grows month over month |
| Consideration | Completion rate | Watch time, retention curve | Video platform | 40 to 60% (mid-length) |
| Intent | CTA click-through rate | Form starts, session clustering | Video platform + GA4 | 5 to 15% depending on placement |
| Decision | CRM-logged video events | Demo requests post-view | CRM (HubSpot, Salesforce) | Event fires within minutes of the watch |
| Retention | Video-influenced renewal signals | Support ticket reduction, repeat views | CRM + product analytics | Directional, benchmark against your own baseline |
If a stakeholder reads nothing else in this article, this table is the skim path: what to track, and where to find it, at each funnel stage.
Common Video Measurement Mistakes That Skew the Data
- Comparing raw view counts across platforms without normalizing for each platform's view definition.
- Treating a 3-second autoplay view the same as an intentional click-to-play, which inflates reach numbers with low-intent traffic.
- Reporting a single blended completion rate instead of a retention curve, which hides where and why viewers actually drop off.
- Relying on GA4 alone for in-video behavior, when GA4 tracks page-level events, not frame-by-frame viewer behavior inside the player.
- Leaving gated content unprotected, which lets scraped or shared views quietly inflate every metric above it.
Fix the mistake closest to Layer 1 first. Errors compound upward: a bad reach number produces a misleading completion rate, which produces a false intent signal, which sends sales chasing accounts that were never real.
Frequently Asked Questions
1. What is the most important video marketing metric to track?
There isn't one universal answer, because the right primary metric depends on the funnel stage. For awareness content, reach and unique viewers matter most. For consideration-stage demos, completion rate and retention curve matter more. For late-funnel content, the metric that actually matters is whether a specific video event reached your CRM as a logged contact activity.
A metric that never leaves the video platform's dashboard cannot influence a sales decision, no matter how good the number looks.
2. How is video engagement rate calculated?
Video engagement rate is calculated by dividing total time played by the total number of plays multiplied by the video's length, then expressing that as a percentage.
A 2-minute video played by 1,000 people for a combined 10 hours has a 30% engagement rate. This tells you the average depth of viewing, not just whether someone pressed play. If your reporting only shows play count and never engagement rate, you're seeing volume, not quality.
3. Why does my CRM show fewer conversions than my video platform reports?
This gap exists because most video platforms count every qualifying interaction inside their own system, while your CRM only logs conversions that were successfully passed through an integration, a UTM parameter, or an API event.
If that connective layer is missing or partially configured, video-side numbers will always run higher than CRM-side numbers. Treat any video platform metric that isn't also visible on a contact record in your CRM as unverified until the integration is confirmed working.
4. What is a good video completion rate for a demo or product video?
For a product demo running 1 to 3 minutes, a completion rate of 40 to 60% is solid, and anything above 60% is strong. For webinars or long-form demos over 5 minutes, 30% is a reasonable benchmark because natural drop-off increases with length.
Comparing a 90-second demo's completion rate against a 45-minute webinar's completion rate as if they're the same metric produces a meaningless conclusion either way.
Benchmark completion rate against videos of similar length and intent, never against your entire video library as one blended number.
5. Can I measure video marketing performance without a dedicated video analytics tool?
Basic reach and engagement tracking is possible through native platform analytics (YouTube Studio, Meta Business Suite) combined with Google Analytics 4 for on-site behavior. What's not possible without a dedicated video platform is reliable Layer 4 attribution, the CRM-level event sync that connects a specific watch session to a specific contact record.
If CRM-connected attribution matters to your reporting, evaluate video platforms with native event streaming before relying on GA4 and native analytics alone.
6. How do video hosting platforms differ in CRM measurement capability?
The mechanism varies by platform.
Gumlet's Segment-wise Messaging fires a viewer-crossing-50%-watched or CTA-click event directly into connected marketing and sales tools without a custom integration project.
Wistia sends engagement milestones (25%, 50%, 75%, 100% watched), poll responses, and form fills through HubSpot's Timeline API once a viewer is identified via Turnstile or a HubSpot form.
Vidyard posts a media play event to a contact's HubSpot activity timeline on viewer identification, with a separate form-fill event logged on conversion.
All three make video behavior visible on a CRM record. The differences are in identification method, setup effort, and whether the sync requires a native connector or middleware.
7. What is a video-qualified lead?
A video-qualified lead, or VQL, is a contact whose watch behavior meets a threshold the marketing team has set as an indicator of sales readiness, typically a percentage watched combined with a CTA click or form fill. The threshold is not fixed. A 75% watch depth might qualify a lead on a 5-minute demo, while a 90% watch depth is more appropriate for a 2-minute overview, since shorter videos naturally see higher completion.
8. What should marketers look for in a video hosting platform to measure performance accurately?
Four criteria matter most:
- CRM event streaming that doesn't require a custom integration project, since engineering backlog is the most common reason attribution never gets built.
- Segment-level triggering, so different viewer actions can fire different CRM events instead of one blanket "watched" flag.
- Data integrity controls like tokenized links and dynamic watermarking, since a platform with strong analytics but weak access control is measuring a partially wrong audience.
- Funnel-stage mapping, the ability to tie a specific video event to a specific stage (awareness, consideration, decision) rather than reporting one undifferentiated engagement number.
A platform that's strong on analytics but weak on any of these three still leaves the attribution gap this article describes.
The Real Measurement Problem isn't the Metrics
Most video measurement advice fails for the same reason: it treats the problem as a missing metric when it's actually a missing connection.
The All-in-One Platform for Effective SEO
Behind every successful business is a strong SEO campaign. But with countless optimization tools and techniques out there to choose from, it can be hard to know where to start. Well, fear no more, cause I've got just the thing to help. Presenting the Ranktracker all-in-one platform for effective SEO
We have finally opened registration to Ranktracker absolutely free!
Create a free accountOr Sign in using your credentials
Views, watch time, and completion rate aren't wrong to track. They're incomplete on their own, because none of them answer the question a CFO actually asks: did the video move a specific deal forward.
The fix isn't a longer list of KPIs. It's building the pipe between Layer 2 engagement data and Layer 4 CRM records, and protecting the integrity of that data at Layer 5 so the numbers flowing through the pipe describe your actual audience.
If you're auditing your own video program this quarter, pull up a single high-intent video, a demo or a product walkthrough, and check whether a single watch event from the last 30 days shows up anywhere in your CRM.
If it doesn't, that's the layer to fix first, not the next video you produce. Explore how Gumlet, a video marketing platform built for SaaS and SMB teams that need CRM-connected measurement without a custom integration project, handles this end-to-end, before arriving at a decision.