Intro
The Ranktracker Google Data Studio connector is officially live.
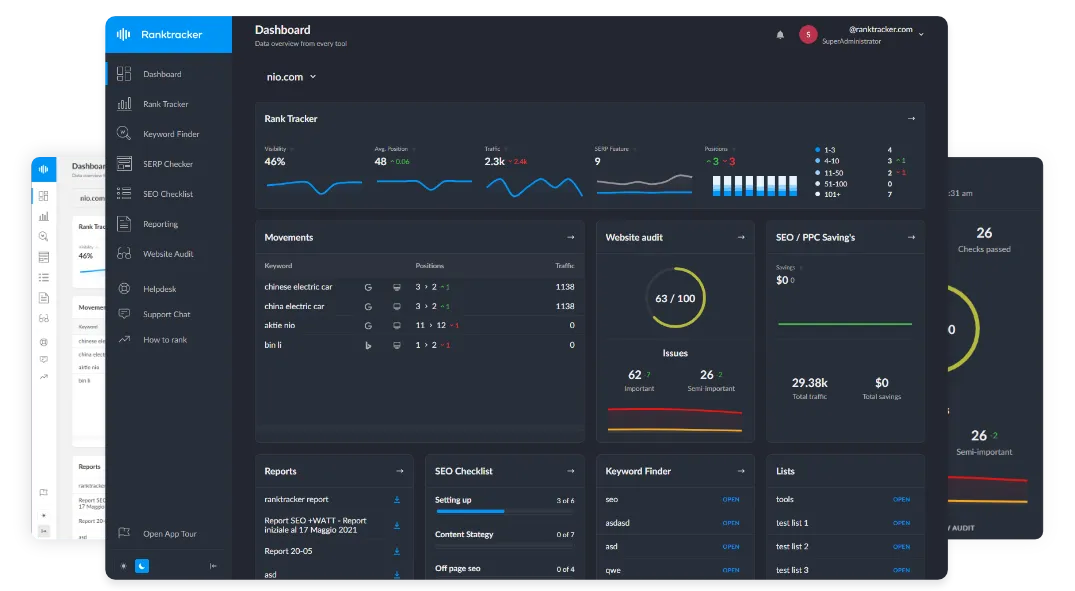
Ranktracker customers can now connect their tracked SEO data directly to Google Data Studio and use it to build automated dashboards, client reports and internal performance reports.
Google Data Studio was previously known as Looker Studio, so you may still see both names used across existing reports, documentation and online resources.
The new Ranktracker connector means you no longer need to download ranking data manually, copy information into spreadsheets or rebuild the same SEO report every month.
Connect your Ranktracker account, select the project you want to report on and start turning your SEO data into interactive charts, tables and scorecards.
Access to the Ranktracker Google Data Studio connector is included with every Ranktracker plan.
Turn Ranktracker Data Into Custom SEO Dashboards
Ranktracker already gives you detailed information about your tracked keywords, current rankings, ranking movements, locations, devices and search visibility.
The All-in-One Platform for Effective SEO
Behind every successful business is a strong SEO campaign. But with countless optimization tools and techniques out there to choose from, it can be hard to know where to start. Well, fear no more, cause I've got just the thing to help. Presenting the Ranktracker all-in-one platform for effective SEO
We have finally opened registration to Ranktracker absolutely free!
Create a free accountOr Sign in using your credentials
The Google Data Studio connector gives you another way to present that information.
Instead of using a fixed reporting layout, you can decide:
- Which metrics are displayed
- How the information is visualized
- Which keywords or projects are included
- What date ranges users can select
- Which filters clients can use
- How the report is branded
- Who can view or edit the dashboard
You can create a simple one-page ranking overview or build a complete multi-page SEO reporting dashboard.
The finished dashboard can be shared with clients, managers, team members and other stakeholders without sending a new spreadsheet every time the rankings change.
Why We Built the Data Studio Connector
SEO reporting often involves more manual work than it should.
Agencies may manage dozens or hundreds of client projects. In-house teams may need to prepare weekly reports for several departments. Consultants may spend hours downloading ranking data and moving it into presentation templates.
That process creates several problems:
- Reports become outdated quickly
- Manual copying increases the risk of errors
- Different reports use inconsistent metrics
- Teams spend time formatting data instead of analysing it
- Clients must wait for someone to prepare the latest report
- Historical comparisons become harder to maintain
The Ranktracker Google Data Studio connector creates a direct reporting connection.
Once the data source has been configured, your dashboard can retrieve the latest available information from your Ranktracker account.
The All-in-One Platform for Effective SEO
Behind every successful business is a strong SEO campaign. But with countless optimization tools and techniques out there to choose from, it can be hard to know where to start. Well, fear no more, cause I've got just the thing to help. Presenting the Ranktracker all-in-one platform for effective SEO
We have finally opened registration to Ranktracker absolutely free!
Create a free accountOr Sign in using your credentials
You can build the report once and continue using it as your SEO campaign develops.
Data Studio Access Is Included With Every Ranktracker Plan
The connector is available across every Ranktracker subscription:
- Launch
- Growth
- Scale
- Authority
You do not need to purchase a separate connector subscription or pay for an additional third-party reporting platform simply to move your Ranktracker data into Google Data Studio.
The amount of information available will depend on the projects, keywords, tracking rows and allowances included with your Ranktracker plan.
Customers on every plan can still use the connector to create custom dashboards around the Ranktracker data already available in their account.
What Can You Report On?
The connector is designed to help you visualize the tracked keyword and ranking information inside your Ranktracker projects.
Depending on the report and selected fields, you can build dashboards covering areas such as:
- Tracked domains
- Keywords
- Current ranking positions
- Historical ranking performance
- Daily, weekly and monthly movements
- Ranking URLs
- Search engines
- Countries and locations
- Desktop and mobile rankings
- Search volume
- Estimated traffic
- Keyword difficulty
- Cost-per-click data
- SERP features
- AI Overview visibility
- Keyword tags and groups
Ranktracker tracks the complete Top 100 organic results rather than limiting visibility to the first page. This means your dashboards can also show keywords that are beginning to improve even when they have not yet entered the Top 10.
These lower-ranking keywords can be extremely valuable because they reveal potential opportunities before they become obvious in page-one reports.
Build an Executive SEO Overview
Not every stakeholder needs to see every tracked keyword.
Business owners, directors and senior managers often need a concise summary that answers a few important questions:
- Is organic visibility improving?
- How many keywords rank on page one?
- How many keywords have gained or lost positions?
- Which pages are performing best?
- Are priority keywords moving in the right direction?
- Where are the biggest opportunities?
Using scorecards, trend charts and summary tables, you can turn detailed ranking data into a high-level executive dashboard.
A typical executive overview could include:
- Average ranking position
- Keywords in the Top 3
- Keywords in the Top 10
- Keywords in the Top 20
- Keywords in the Top 100
- Estimated organic traffic
- Ranking gains
- Ranking losses
- Visibility over time
- Best-performing landing pages
The report can give decision-makers a clear understanding of SEO performance without overwhelming them with hundreds of individual rows.
Create Detailed Keyword Ranking Reports
SEO specialists can build more detailed reports for investigating individual keywords.
A keyword performance table could contain:
- Keyword
- Current position
- Previous position
- Position change
- Search volume
- Ranking URL
- Device
- Location
- Search engine
- Keyword group
- SERP features
Filters can then allow users to focus on specific sections of the campaign.
For example, a report viewer could filter the dashboard to show:
- Only branded keywords
- Only mobile rankings
- A specific country
- A particular service
- Keywords connected to one landing page
- Keywords with a minimum search volume
- Keywords that have lost positions
- Keywords currently ranking outside the Top 10
This makes the dashboard useful for analysis as well as presentation.
Find Page-Two SEO Opportunities
Keywords ranking between positions 11 and 20 are often among the most actionable opportunities in an SEO campaign.
They are already relevant enough to appear near the first page, but they may need stronger content, internal links, backlinks or improved search intent alignment to move into the Top 10.
You can create a dedicated Data Studio table that only displays keywords within this range.
The report could show:
- Keyword
- Current ranking
- Ranking change
- Search volume
- Keyword difficulty
- Current ranking URL
- Device
- Location
This gives your SEO team a regularly updated list of keywords that may be close to producing significantly more traffic.
You can create similar sections for:
- Positions 1–3
- Positions 4–10
- Positions 11–20
- Positions 21–50
- Positions 51–100
- Keywords outside the Top 100
Compare Desktop and Mobile Performance
Search rankings can differ significantly between desktop and mobile devices.
A page may perform well on desktop while struggling on mobile because of:
- Page speed
- Mobile usability
- Different search intent
- Localized results
- SERP layout differences
- Mobile-specific competitors
The Ranktracker connector can help you separate and compare tracking data by device.
You can create:
- Desktop-only ranking reports
- Mobile-only ranking reports
- Side-by-side device comparisons
- Device filters
- Mobile ranking-loss tables
- Device-specific visibility charts
This makes it easier to identify problems that might be hidden inside an overall average.
Report Across Countries and Locations
Ranktracker supports local, national and international tracking across more than 107,000 locations.
The same keyword can perform differently depending on where the search takes place.
A company may rank in London but not Manchester. An international website may perform strongly in the United Kingdom but struggle in the United States. A franchise may have different visibility across each service area.
Data Studio filters and report pages can help you organize this information by:
- Country
- City
- Region
- Search engine
- Language
- Device
An international SEO report could have one page for each country.
A local SEO dashboard could allow the viewer to select a city from a dropdown menu.
An agency could use a shared reporting structure while connecting each client to their own Ranktracker data source.
Monitor Ranking Winners and Losers
A useful SEO dashboard should not only show current rankings. It should also make changes easy to identify.
You can create separate tables for:
Biggest ranking gains
Show keywords that have moved up the most during the selected period.
This can help identify:
- Successful content updates
- Pages benefiting from new backlinks
- Technical fixes that improved visibility
- Recently published pages beginning to rank
- Campaigns producing measurable progress
Biggest ranking losses
Show keywords with the largest negative movements.
This can help identify:
- Potential algorithm-update effects
- Content decay
- Competitor improvements
- Lost or changed landing pages
- Technical SEO problems
- Search intent changes
- SERP feature changes
Conditional formatting can make these reports easier to scan by highlighting positive and negative movement.
Build Client-Friendly SEO Reports
Agencies can use the Ranktracker connector to create branded dashboards for their clients.
A report can include:
- The agency’s logo
- The client’s logo
- Brand colors
- Explanatory notes
- Campaign targets
- Ranking summaries
- Keyword movement charts
- Landing-page tables
- Recommended next steps
Once the report has been created, it can be shared using Data Studio’s existing sharing controls.
Clients can receive view-only access while account managers and SEO specialists retain editing access.
Interactive controls allow clients to explore the data without changing the underlying report.
For example, a client could:
- Change the date range
- Select desktop or mobile
- Filter by keyword category
- Choose a location
- Search for a keyword
- View one landing page
- Sort a table by search volume or position
This creates a more useful reporting experience than a static monthly PDF.
Combine Ranktracker With Google Search Console
One of the biggest advantages of Google Data Studio is the ability to connect multiple data sources to one report.
Ranktracker data can be displayed alongside Google Search Console information.
This allows you to compare:
- Tracked position
- Search impressions
- Organic clicks
- Click-through rate
- Search Console average position
- Ranking URL
- Query performance
Ranktracker and Search Console serve different purposes.
Search Console reports on the queries and clicks Google has attributed to your verified website. Ranktracker monitors the specific keywords, locations, devices and competitors you choose to track.
Using both sources together gives you a broader picture.
For example, a keyword could be improving in Ranktracker while Search Console impressions are also increasing. Another keyword may rank well but generate a low click-through rate because of the SERP layout or an unattractive title.
Combine Ranktracker With Google Analytics
You can also place Ranktracker ranking data alongside Google Analytics information.
A combined dashboard could show:
- Keyword visibility
- Organic users
- Organic sessions
- Landing-page engagement
- Conversions
- Leads
- Ecommerce revenue
- Average engagement time
- Conversion rate
This helps connect SEO activity with business performance.
Ranking improvements are useful, but most organizations ultimately want to understand whether those improvements are creating visits, enquiries, sales or revenue.
A combined dashboard makes it easier to move from:
Our rankings increased.
to:
Our priority rankings increased, organic traffic grew and the affected landing pages generated more conversions.
Add Google Ads and Other Marketing Sources
Data Studio also allows teams to build broader marketing reports.
Your Ranktracker rankings can sit alongside data from:
- Google Ads
- Google Search Console
- Google Analytics
- Google Sheets
- YouTube
- BigQuery
- CRM platforms
- Social advertising platforms
- Call-tracking systems
This can be especially valuable for agencies delivering several marketing services.
Instead of sending separate SEO, PPC and analytics reports, the agency can create one connected performance dashboard.
SEO data remains clearly separated, but the client can see how it contributes to the wider marketing strategy.
Create Calculated SEO Metrics
Data Studio supports calculated fields, allowing you to build additional metrics from the available data.
Depending on your report structure, you could create custom groupings such as:
- Page-one keywords
- Top-three keywords
- Keywords outside the Top 100
- Positive movement
- Negative movement
- High-volume opportunities
- Branded versus non-branded keywords
- Local versus national keywords
- Priority landing pages
For example, you could classify every keyword into a ranking group:
- Top 3
- Positions 4–10
- Positions 11–20
- Positions 21–50
- Positions 51–100
- Not ranking
These calculated groups can then be used in charts, tables and filters.
Use Date Controls and Interactive Filters
Data Studio reports can include interactive controls that let viewers change what they see without editing the report.
Useful controls for a Ranktracker dashboard may include:
- Date range
- Domain
- Device
- Location
- Search engine
- Keyword
- Keyword tag
- Ranking group
- Landing page
This means one dashboard can support several reporting needs.
An account manager may want a complete overview. An SEO specialist may want to investigate one keyword group. A content manager may only want to see rankings connected to the blog.
Each person can use the same dashboard while filtering it to their role.
How to Connect Ranktracker to Google Data Studio
The exact connection screen may vary slightly as Google updates Data Studio, but the general process is straightforward.
- Sign in to your Ranktracker account.
- Open the Google Data Studio connector.
- Sign in to the Google account used for your reports.
- Authorize the Ranktracker connector.
- Select the Ranktracker account or project you want to use.
- Choose the appropriate data configuration.
- Add the new data source to a report.
- Select the dimensions and metrics for your first chart.
- Save and share the report.
After the data source has been added, you can use it in:
- Tables
- Scorecards
- Time-series charts
- Bar charts
- Pie charts
- Filters
- Date controls
- Calculated fields
- Blended data sources
You do not need to write code or manually call the Ranktracker API.
Suggested Dashboard Structure
A complete Ranktracker Data Studio report could use the following structure.
Page 1: SEO overview
Include:
- Average position
- Top 3 keyword count
- Top 10 keyword count
- Top 100 keyword count
- Estimated traffic
- Visibility trend
- Ranking gains and losses
Page 2: Keyword performance
Include:
- Complete keyword table
- Current position
- Position change
- Search volume
- Ranking URL
- Device and location filters
Page 3: Ranking opportunities
Include:
- Keywords in positions 4–10
- Keywords in positions 11–20
- High-volume keywords outside page one
- Landing pages with several near-page-one keywords
Page 4: Winners and losers
Include:
- Largest daily gains
- Largest weekly gains
- Largest monthly gains
- Largest losses
- Newly ranking keywords
- Keywords that left the Top 100
Page 5: Landing pages
Include:
- Ranking URL
- Number of ranking keywords
- Best position
- Average position
- Combined search volume
- Organic sessions
- Conversions
Page 6: Location and device performance
Include:
- Desktop versus mobile
- Country comparisons
- City or regional filters
- Search-engine filters
- Location-specific keyword tables
Data Studio, API or MCP: Which Should You Use?
Ranktracker now provides three different ways to work with your SEO data.
| Tool | Best suited for |
| Google Data Studio connector | Visual dashboards and client reporting |
| Ranktracker REST API | Custom applications, automated workflows and data warehouses |
| Ranktracker MCP server | Conversational analysis using AI assistants |
Use the Data Studio connector when you want to visualize and share SEO data without building your own reporting application.
Use the REST API when developers need structured programmatic control over domains, competitors, keywords, rankings and SERP data.
Use MCP when you want to ask an AI assistant questions about the data inside your Ranktracker account.
Many teams can benefit from using all three.
An agency might use:
- Data Studio for client dashboards
- The API for automated onboarding
- MCP for internal SEO analysis
Stop Rebuilding the Same SEO Report
SEO teams should spend their time interpreting data and improving performance, not copying numbers between platforms.
The All-in-One Platform for Effective SEO
Behind every successful business is a strong SEO campaign. But with countless optimization tools and techniques out there to choose from, it can be hard to know where to start. Well, fear no more, cause I've got just the thing to help. Presenting the Ranktracker all-in-one platform for effective SEO
We have finally opened registration to Ranktracker absolutely free!
Create a free accountOr Sign in using your credentials
The Ranktracker Google Data Studio connector gives customers a flexible way to turn tracked ranking data into automated, interactive reports.
You can build a dashboard once, customize it around your reporting requirements and continue using it as new Ranktracker data becomes available.
Use it to:
- Create branded client dashboards
- Monitor ranking trends
- Find page-two opportunities
- Compare desktop and mobile
- Report across multiple locations
- Combine rankings with Analytics and Search Console
- Track SEO progress without manual exports
The Ranktracker Google Data Studio connector is now live and access is included with every Ranktracker plan.
Open the connector from your Ranktracker account and start building your first SEO dashboard today.