Intro
Data visualization is the geographical presentation of images in order to elaborate more on data trends. Examples of data visualization are graphs, charts, plots, and maps.
For a good foundation in search engine optimization (SEO), you should have a well-thought-out strategy. Data visualization for SEO allows traffic to your website. This promotes your website and hence makes it outshine your competitors.
Data visualization for SEO weighs the competitiveness of a keyword against its traffic. This helps in aggregating the numbers collected. With data visualization for SEO, you are able to generate more views on your website. In marketing, data visualization for SEO will enable one to put their digital marketing game up.
Data visualization sets your website according to the keyword that your potential customers are searching for. Data visualization attracts more clients to a website and, hence, allows them to get answers to their queries.
Any keyword research that a potential client uses in a search engine will determine the volume of traffic to your website.
It has been confirmed that 68% of online experiences begin with SEO.
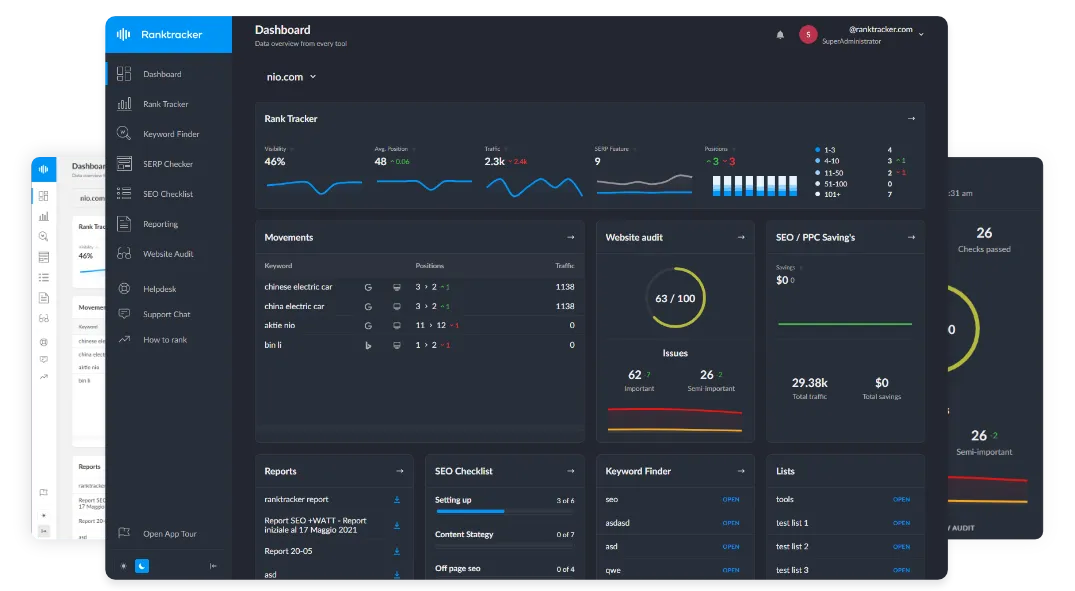
The All-in-One Platform for Effective SEO
Behind every successful business is a strong SEO campaign. But with countless optimization tools and techniques out there to choose from, it can be hard to know where to start. Well, fear no more, cause I've got just the thing to help. Presenting the Ranktracker all-in-one platform for effective SEO
We have finally opened registration to Ranktracker absolutely free!
Create a free accountOr Sign in using your credentials
You should ensure that you use data visualization techniques that will provide adequate answers to your customers.
When using data visualization techniques, you are giving your audience what they are looking for. Data visualization gives a comprehensive story that SEO can tell.
It is advisable to use data visualization for SEO if you need to improve your reporting. Visuals make your data easier and more interesting for your clients to digest.
Keyword research is very important as it allows one to understand what to look for in a website. In data analysis, you should make a data visualization for SEO that is user-friendly. If a website is hard to understand, clients might not come back to it. Your website might also get poor ratings from search engines such as Google.
From the research, it has been concluded that 39% of buyers have been influenced by keyword research.
Data visualization tools such as graphs (line chart, bar chart, Box and Whisker plot, gauge chart, etc.) and maps enable your clients to know the location of your business. Data visualization for SEO enhances trend analysis, which allows one to understand the performance of a business. Trend analysis also helps in predicting current business operations and where your current practices will take you.
The All-in-One Platform for Effective SEO
Behind every successful business is a strong SEO campaign. But with countless optimization tools and techniques out there to choose from, it can be hard to know where to start. Well, fear no more, cause I've got just the thing to help. Presenting the Ranktracker all-in-one platform for effective SEO
We have finally opened registration to Ranktracker absolutely free!
Create a free accountOr Sign in using your credentials
In marketing, data visualization increases efficiency and improves the delivery of infographics that are turned into valuable insights. Potential buyers are more persuaded by a product or service if they can see visuals.
It has been noted that 53% of marketers promote their businesses by using data visualization for SEO.
Data visualization for SEO allows easy and efficient data analysis. Visuals enable data analysis, which enhances data-driven decisions. This allows you to take your business or organization to the next level of growth.
Proper data analysis and trend analysis enhance the growth of the company. Poor data analysis might pull your company backward in terms of growth.
Data visualization allows easy data analysis for the user. In data visualization for SEO, trend analysis is important in predicting the future of your company. Trend analysis is also very important in data visualization. This allows you to make logical decisions for the organization.
How to choose the right visualization technique
- Recognize the main message you want to pass to your audience. Summarize it by making it short and easy for them to understand.
- Locate the data you need to visualize. Make sure you make it clear for easy understanding of the message.
- Contemplate the type of data you have at hand. It could be patterns, comparisons, trends, geographical and distribution data.
- Decide on the data visualization to use that will capture the attention of your audience.
- Make sure that your data visualization is visible to your audience
- Review what to include in the visualization so as to make it easy for your audience. Ensure that the information is easy to read and interpret.
- Table data visualization with cells, rows, columns, and grids is a smart way of dynamic data visualization.
What is data capture and how to use it?
Importance of data visualization for SEO
Data visualization for SEO makes it easy and fast to pass insights to your audience. Let us take a look at the importance of data visualization for SEO
Helps create vigorous value for your website
Data visualization for SEO convinces your clients or stakeholders how and why your products or services are good. It has been noted that blogs and articles with videos increase their website traffic by 157%
Data visualization increases buy-ins into ideas.
Your potential clients are able to understand trend analysis from the data visualization presented. This helps improve website traffic into sales, hence contributing to a company’s success.
Easy analysis of patterns and trends
As a business owner, you are supposed to make decisions based on current market patterns and trends. Therefore, choosing data visualization for SEO is a key strategy to improve your business.
By understanding patterns and trends in the markets, data analysis and interpretation become easy.
Facilitates faster and easier communication
Data visualization for SEO makes your business outshine your competitors. It allows you to pass a message in an easy way for your audience to understand and interpret.
It is believed that more people focus on visuals instead of text. Therefore, with the right keyword research, you are able to capture your audience’s attention. This helps persuade potential clients or investors.
Helps improve customer experience
Data visualization is a critical strategy to improve customer experience. Customers are always happy when they feel that their requirements are included.
The All-in-One Platform for Effective SEO
Behind every successful business is a strong SEO campaign. But with countless optimization tools and techniques out there to choose from, it can be hard to know where to start. Well, fear no more, cause I've got just the thing to help. Presenting the Ranktracker all-in-one platform for effective SEO
We have finally opened registration to Ranktracker absolutely free!
Create a free accountOr Sign in using your credentials
This makes your audience visit your website more often.
Conclusion
Data visualization is a key necessity to the contribution of your company’s success. With data visualization for SEO, your audience meets their needs with the right keyword research use.
Make sure you simplify your data into visuals to enable easy data analysis and interpretation. Charts, diagrams, graphs, or maps communicate your data in a very efficient way in marketing.
Data visualization increases traffic to a website, and this boosts a business's success. Data visualization for SEO enables your audience to understand trend analysis.
By understanding trend analysis, you are able to come up with data visualization that boosts your business. This is because potential clients and stakeholders are more attracted by visuals.